
Editor’s note: Caitlin Fong is a researcher and Benjamin Halpern serves as executive director, both at the National Center for Ecological Analysis and Synthesis (NCEAS), UC Santa Barbara. In this blog, the authors introduce a new tool for communities to measure wildfire resilience at a landscape scale, with an accompanying dashboard at wildfireindex.org. Explore the dashboard to see how your community compares.
You’re a manager – maybe a fire chief, a city council member, or a governor – trying to decide where to focus limited wildfire mitigation dollars before next fire season. You know some places in your region are more exposed, stretched thinner than others. Key forests are at risk, havens for nature and a playground for people in your community, and buildings, even whole communities, are vulnerable. But when you sit down to make the case for a specific investment — a landscape treatment here, a community preparedness program there — you’re working from a patchwork of datasets that don’t speak the same language, cover the same geography, or measure the same things in the same currency.
You can describe the problem, but it’s harder to quantify it. Not in a way that holds up in a budget meeting or a grant application, or in a way where you could measure the efficacy of an investment after the fact. Wildfire resilience is a goal everyone agrees on, but there’s been no shared, quantitative way to measure it. No way to compare a watershed in Oregon to a county in California or a management unit in Alaska. This gap has been a persistent frustration in wildfire resilience work, and has shaped and limited how we invest.
We created the Wildfire Resilience Index (WRI) to directly address this challenge. The Index is a free, open-access tool to measure wildfire resilience across both people and ecosystems, for every community and landscape in the U.S. and Canadian West, at 90-meter resolution. You can look up your place right now at wildfireindex.org.
What We Built, and Why
The WRI is not a fire risk map. It doesn’t tell you the probability of fire burning in a given area — there are already good tools for that, such as Wildfire Risk to Communities. What it measures is something different and, we’d argue, more actionable for practitioners: resilience. How well can a place and its people withstand wildfire when it comes? And if it does come, what is the potential and pathway to recover?
We split resilience into these two components — resistance (the ability to withstand fire impacts) and recovery (the ability to regain function afterward) — because treating them as a single score hides something important. Knowing a place is resilient doesn’t tell you whether it got there through strong building codes, social networks and robust conservation actions, or through wealth and access to federal disaster programs, or on the environmental side because the trees can quickly resprout after a fire. These different places would require completely different interventions to build overall resilience. The WRI shows both, so you can target the right intervention levers.
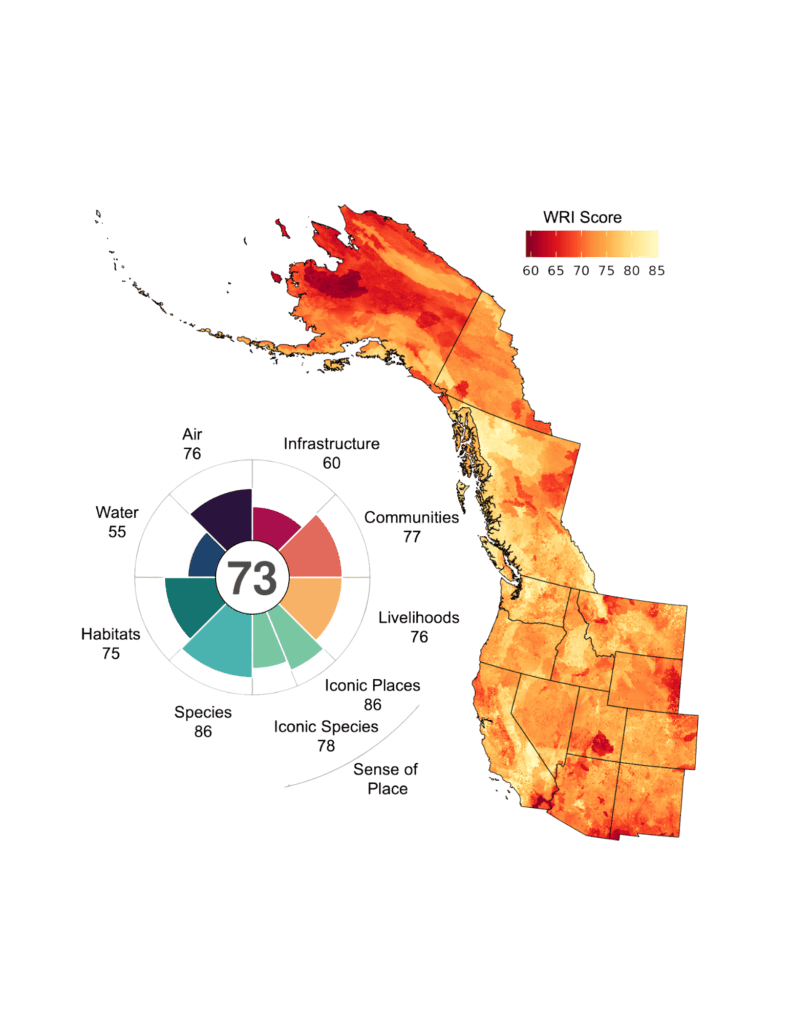
To capture these differences, we built the Index to include resistance and recovery across eight socio-ecological domains: Infrastructure, Communities, Livelihoods, Sense of Place, Species, Habitats, Water, and Air. Some of these are primarily social. Some are ecological. Most are both. And that’s intentional! Wildfire doesn’t respect the line between people and landscapes, and neither does resilience. A community with strong social cohesion but aging infrastructure in a fire-prone watershed needs a different strategy than one with hardened homes but weak local organization. The WRI can tell you which situation you’re looking at, and compare different places to tailor intervention strategies appropriately.
.png")
All of this is built from nearly 100 publicly available datasets spanning satellite imagery, census records, building code assessments, species range maps, air quality monitoring, hydrological data, species trait data and more, all integrated at very high spatial resolution (90 meter, or about the footprint of football field). We have aggregated scores for over 19,000 pre-calculated geographies – including census tracts, counties, congressional districts, watersheds, ecoregions, and national parks – so that you can look up scores for whatever region and purpose is most useful to you. Every dataset, every weighting decision, and all the underlying code are publicly documented and freely available for download.
Importantly, The WRI doesn’t prescribe a single approach to increasing resilience. It identifies where the gaps are, by domain and by place, so that interventions can be appropriately targeted. Both social and ecological actions are often necessary. The index helps reveal where change can happen to improve things, and the trade-offs that come with different paths forward.
What the Data Shows
Across western North America, the average WRI score is 73 out of 100. But that average conceals a great deal — and the variation is where the useful information lives.
The finding that surprised us most: resistance lags recovery almost everywhere. Across nearly every domain and geography we examined, communities and landscapes are significantly better equipped to bounce back from wildfire than to withstand it in the first place. We are, collectively, more dependent on recovery than we might like to be. That means we’re absorbing more damage than necessary — and in a future of more frequent, more severe fire, that’s a gap we can’t afford to ignore. Filling it requires investment before fire, not just after.
The equity finding: resilience tracks closely with wealth. Not because fire behaves differently in rich and poor communities, but because wealth shapes everything that determines preparedness and recovery, including building materials, access to aid programs, types of jobs, and capacity of communities to organize, among other factors. Communities with lower incomes and fewer homeowners score lower on recovery, even when local social ties are strong. The WRI can help direct limited resources toward these communities first, providing a defensible, data-driven basis for equity-focused investment.
The finding that matters most for how you use the tool: two places with the same overall WRI score can have completely different domain profiles — and therefore need completely different interventions. The overall number is the beginning of the conversation. The domain breakdown is where the work is.
How to Use It
The dashboard at wildfireindex.org is built for practitioners. You don’t need to be a data scientist to use it.
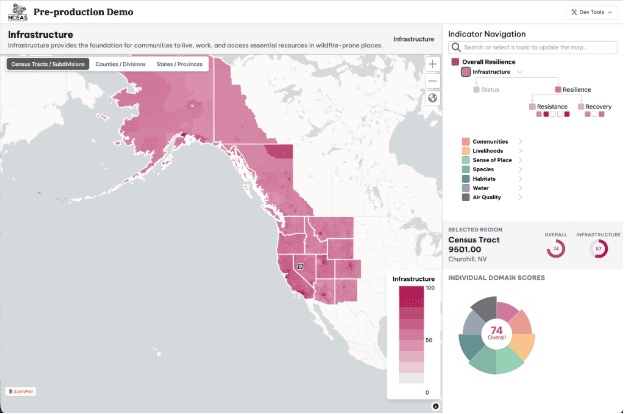
Search for your census tract, your county, your congressional district, your state. You’ll see an overall WRI score, scores for each of the eight domains, and the resistance and recovery breakdown within each domain. You can download the underlying data for your own analysis.
Here are a few ways we think practitioners could use the WRI. We would love your feedback!
Landscape treatment prioritization. Where resistance is low and fire hazard is high, pre-fire investment is most urgent. The WRI is designed to be used alongside hazard maps, not instead of them. Together, they tell you not just where fire is likely, but where the consequences of fire will be hardest to absorb and hardest to recover from.
Post-fire resource allocation. Low recovery scores identify communities that are least equipped to rebound — the ones that most need technical assistance navigating disaster programs, restoration funding, and rebuilding support. Ranking fire-affected areas by recovery potential score can help ensure that limited post-fire resources go where they’re needed most, not just where the loudest voices are.
Cross-boundary coordination. Because the WRI uses a consistent framework across all geographies, it enables comparison across jurisdictions, land tenures, and administrative boundaries that don’t usually talk to each other. A shared baseline creates a shared starting point for collaboration.
CWPP planning. The domain scores map directly onto the kinds of questions Community Wildfire Protection Plans are trying to answer — where are building code gaps, where is organizational capacity weakest, where do landscapes need treatment most? We’re genuinely curious whether WRI scores could help practitioners prioritize which elements of a CWPP to strengthen first. If you’re working on a CWPP and want to test it against your local knowledge, we’d love to hear what you find.
Full methods documentation is on the website. If you want to run your own analysis, build your own aggregations, or test the framework against your local knowledge, we want you to, and we want your feedback!
What We Still Don’t Know
A high WRI score is not a guarantee of safety. Climate change is shifting fire regimes, potentially faster than any index can track. Extreme events like severe drought, windstorm-driven fires, or compounding stressors can overwhelm even highly resilient systems. We built the WRI to be useful under current and near-term conditions, not to predict outcomes under a climate future that is still unfolding.
And there are data gaps. Building codes are assessed at the state level, which misses local ordinances that are often stricter. Species threat assessments are incomplete for many taxa. Post-fire recovery dynamics in water and air systems are not yet well-captured. We’ve fully documented these gaps on the website, and we’ll update the index as better data become available.
There is always more science to be done and new and better data to gather, so these gaps are expected. We want you to use the tool with clear eyes rather than be surprised later. We can’t let the desire for perfection stop us from using the best available information. We anticipate spending the next few years identifying and filling gaps, and we’d like your help identifying the most urgent needs.
Your Turn
Wildfire resilience has always been the goal. Now it’s a number — and the number is just the beginning.
Look up your place. See which domains are lowest. Check out individual indicators to see where the biggest liabilities and strengths are, and see if it aligns with your local knowledge. Compare your county to your neighbor. Tell us what doesn’t look right, what surprises you, what you’d do differently.
We built this to be used — by planners making decisions this season, by managers allocating resources right now, by communities trying to understand where they stand.
Dashboard: wildfireindex.org
Data and methods:wildfireindex.org
Contact: wri [at] nceas.ucsb.edu
The Wildfire Resilience Index is hosted at the National Center for Ecological Analysis and Synthesis (NCEAS) at UC Santa Barbara and funded by the Gordon and Betty Moore Foundation.
****
How are dead and dying vegetation taken into account in your analysis?
Hi Roger,
Thanks for asking! We don’t have direct measures of a lot of things. We do have net primary productivity (NPP) in our analysis, which can get at fuel. We also have some estimates of environmental dryness, which are helpful.
We live in the southern section of Deschutes County, Oregon. There is an overall county score which encompasses areas in the county less impacted by wildfire. Is there a resilience score by zip code for the county?
Hi Monte,
Thanks for looking at the dashboard! I would encourage you to toggle to the census tract tab on the map viewer to get finer-scale estimates for locations. We don’t have things by zip code at this point!
Cat
I live in Modoc County, CA. This index seems close on some things and way off on others. You also state that 94%+ have defensible space in Modoc County and that is not the case. We have a majority of senior citizen and almost all of the county is listed as disadvantaged to severely disadvantage communities as mapped out in the State of California Department of Water Resources DAC and EDA Mapping Tool. So being able to make their own defensible space or afford to have someone help, has always been an issue here. How do you get your information and is there anything we can do to help update it?
Hi Stacey,
This is exactly the kind of feedback we’re looking for! I agree that the ability to create/maintain defensible space is a challenge.
Our indicators are not direct values- a score of 94 does not mean 94% of homes have appropriate defensible space. It means that out of a score of 100, the county scores 94 on average.
We calculate defensible space for every structure with satellite data. We then average up to the county level for those scores. So, a county that is mostly city (like San Francisco) might score really high for defensible space because there isn’t a lot of vegetation in the city.
For more local assessments in California, CalFire might be a better resource, and should be more inclusive of what is considered in defensible space; we only include vegetation.